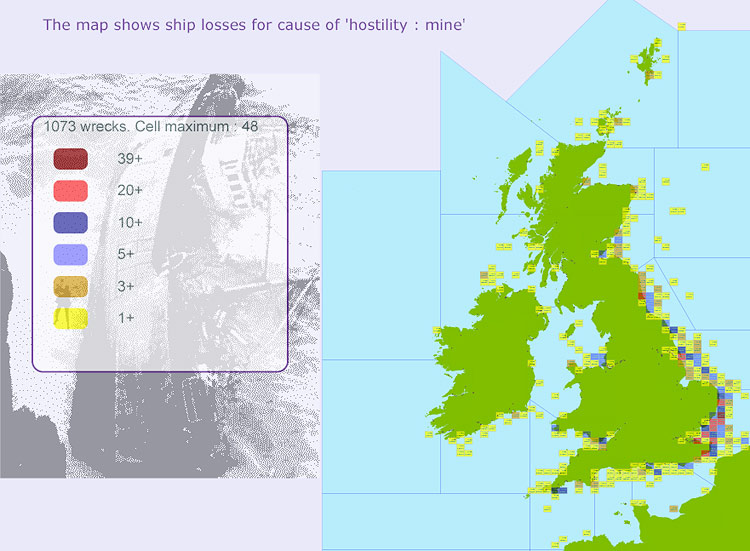
Above: Cells (20' x 10') showing Cause of Loss - Hostility :
Mines : All - Shipwrecks UK area, zoomed-out view. Cells are colour-coded to highlight the density of wrecks
meeting the search criteria. Users can 'drill down' to see more detailed information.
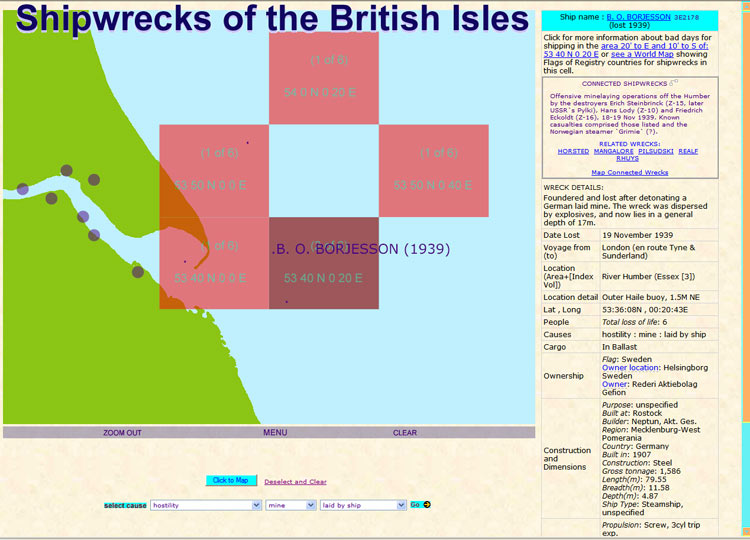
Below: An example of connections between shipwrecks, in this
case those sunk by mines laid by destroyers Z-10, Z-15 and Z-16 on the night of 18th/19th November
1939, using the facility to instantly 'Map Connected Wrecks'.
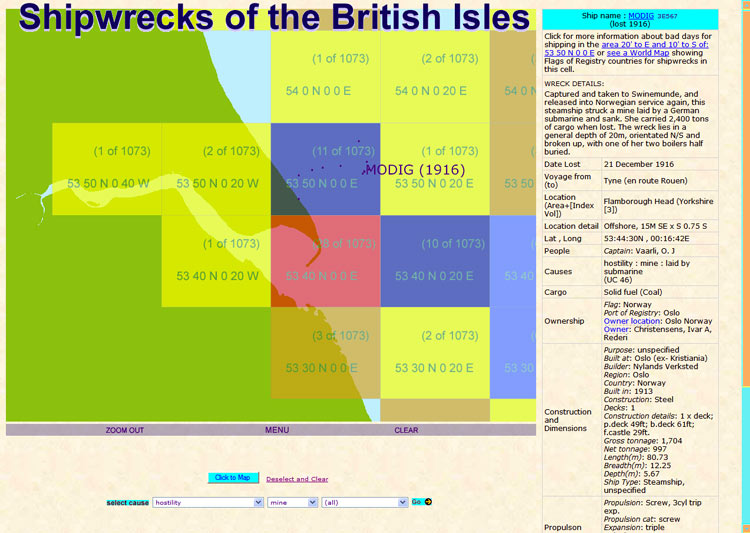
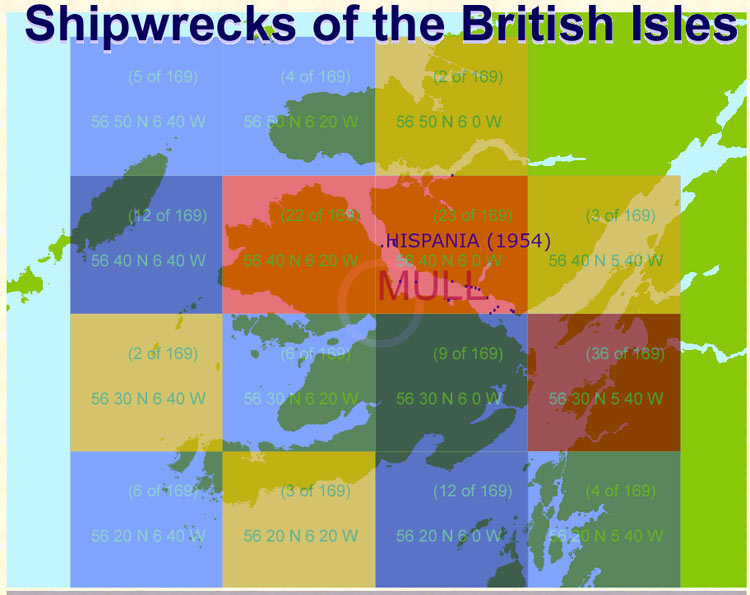
Above: From the zoomed-in view of a small
section of the hostility/mines display, clicking on a cell shows
each wreck that fulfils the search criteria, showing individual
wreck names and year lost on mouseover and full details on further
click.
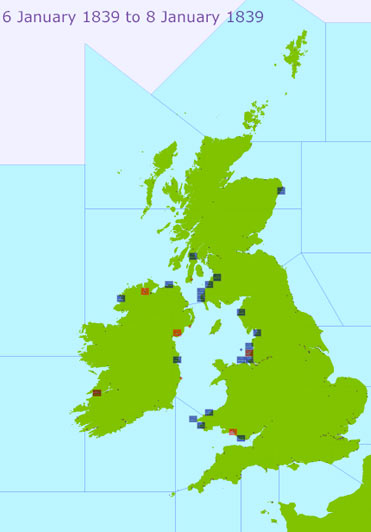
Below, left: Ship casualties of the `Big Wind`. Below,
right: Ship losses where the cargo was salt.

Above: A search for Ship Name of `St Anthony` (from a list of all unique wrecked ship names) progressively
highlights the information shown for the 1527 Loe Bar protected wreck
Below: Each port marked on the map is interactive and yields
hyperlinked information about those ships wrecked in British
waters that were Registered at the port, en route to or from
it, or were built at that location. Distribution of these shipwrecks
can then be instantly visualised by mapping the entire selection.


Above: A section of the display for loss
of life in wrecks of armed ships sunk during WW1 and WW2
Below: All ship losses within a 80 x 40 nautical mile area centred on a selected location; individual wrecks shown within one of the 20 nm x 10nm cells.
 |


